
          true
predict    positive negative
  positive        9      100
negative 1 9001 Sensitivity and Specificity
Sensitivity measures the proportion of positive results out of all truly positive samples. In other words, a test’s sensitivity is its ability to correctly identify those with the disease (the true positives) while minimizing the number of false negative results.
Specificity measures the proportion of negative test result out of all truly negative samples. In other words, a test’s specificity is its ability to correctly identify those without the disease (the true negatives) while minimizing false positive results.
False results are also known as testing errors. The consequences of atesting error- a false positive or a false negative- are not equivalent.
The following is the so-called confusion matrix.
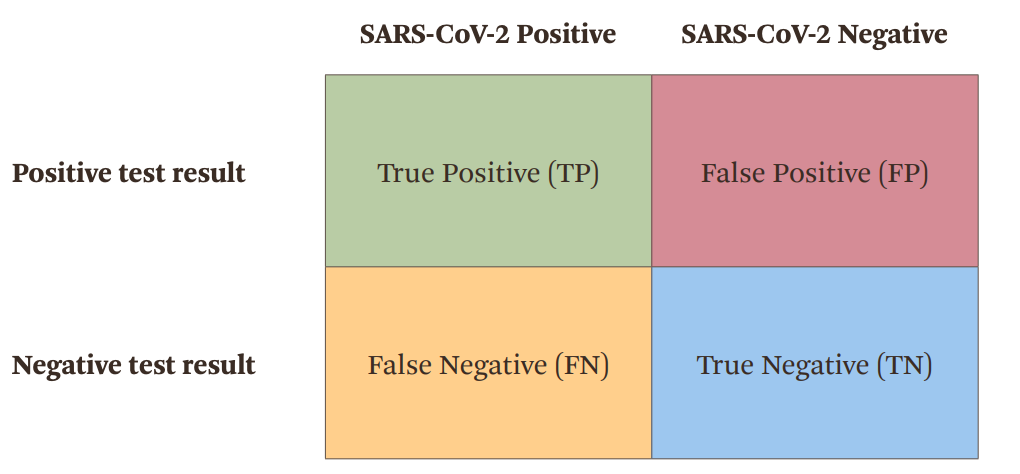
Mthematically: + Sensitivity = TP/(TP+FN) + Specificity = TN/(TN+FP)
2 ROC Curve
The Receiver Operating Characteristic (ROC) curve is a graphical representation used to evaluate the performance of a binary classifier. When we have a sequence of predicted probabilities for two classes, we need to apply a threshold to classify them. Different thresholds lead to different classification results, and for each result, we can calculate sensitivity and specificity. The ROC curve is generated by plotting the true positive rate (TPR) against the false positive rate (FPR) (which is 1-specificity) for every possible threshold (or, more practically, at selected intervals). This provides a visual way to assess the trade-offs between TPR and FPR across varying threshold values.
In binary classification, class predictions for each instance are often based on a continuous random variable
The true True Positive Rate (TPR) at a threshold
Similarly, the False Positive Rate (FPR) is expressed as:
The ROC curve is generated by plotting
The following example comes from wikipedia
imagine that the blood protein levels in diseased people and healthy people are normally distributed with means of 2 g/dL and 1 g/dL respectively. A medical test might measure the level of a certain protein in a blood sample and classify any number above a certain threshold as indicating disease. The experimenter can adjust the threshold (green vertical line in the figure), which will in turn change the false positive rate. Increasing the threshold would result in fewer false positives (and more false negatives), corresponding to a leftward movement on the curve. The actual shape of the curve is determined by how much overlap the two distributions have.
While the Receiver Operating Characteristic (ROC) curve and its Area Under the Curve (AUC) are useful for assessing the overall performance of a binary classifier by focusing on the trade-off between true positive rate (sensitivity) and false positive rate (1-specificity), they do not provide any information about other important metrics such as precision and negative predictive value (NPV).
Precision (or Positive Predictive Value) measures the proportion of true positives among all positive predictions. A high precision means that when the classifier predicts a positive, it’s usually correct. The ROC curve does not consider how well the model distinguishes positives from negatives in terms of predicted labels.
Negative Predictive Value (NPV) is the proportion of true negatives among all negative predictions. Like precision, this metric is not captured by the ROC curve.
A high sensitivity (e.g. 0.9) and specificity (e,g. 0.9) might correspond to low values of precision and negative predictive value. See the matic below
We know that sensitivity=0.9 and specificity=0.9 but precision is 9/100 and NPV is 900/901.
3 AUC
AUC is the area under the curve. How to interpret it?
It is equal to the probability that a classifier will rank a randomly chosen positive instance higher than a randomly chosen negative one.
In other words, when given one randomly selected positive instance and one randomly selected negative instance, AUC is the probability that the classifier will be able to tell which one is which.
Mathematically, we can interpret it by the following: Let
3.1 Connection between AUC and Mann-Whitney U statistic
In binary classification models, once the model fitting is complete, we obtain a set of scores for each sample, indicating the likelihood of belonging to a particular class. By adjusting the threshold, we can calculate the corresponding True Positive Rate (TPR) and False Positive Rate (FPR). In fact, we can order these scores from largest to smallest, and only when the threshold takes on these specific values will the TPR and FPR change.
Starting from the highest score, we progressively lower the threshold. The first threshold is set at
Here,
However, the time complexity of this equation is relatively high,
Since
we can first calculate
Tip
An interesting point is that we can use the probabilistic interpretation of AUC (Equation 1) to compute it. Since AUC represents the probability that a classifier ranks a randomly chosen positive instance higher than a randomly chosen negative instance, we can count how many of the
Warning
In fact, there is a bug when using (Equation 2) to calculate AUC. Consider cases where some samples have identical scores. In these cases, the plot won’t form a rectangle but a triangle, which could introduce some deviation. However, after accounting for ties in the Wilcoxon-Mann-Whitney